Here is a compiled list of the 4 most important browser developer tools that the QA Analysts at 3Qi Labs actively use. All of the main browsers have their own native developing tool built in, however in some cases we opt-out of choosing those tools to using plug-ins, and some can be tricky to implement, while others have some hidden features we will be sharing.
Regardless of what programming language is being implemented in Cucumber, a development tool needs to be used in order to reference the appropriate elements in a browser. Each major browser has its own browser developer tool, although these tools are independent you will notice that they reference values that are identical. As a result, the script is able to run on any browser platform because no matter what browser developer tool you are using it will have the same output.
The Top 4 Browser Developer Tools
Firefox’s FIrebug:
Firebug is a plug-in for Firefox that offers slightly different and more functionality compared to the simple ‘Inspect Element’ tool that is built into the browser, which is why our QA Analysts choose Firebug as their preferred tool for inspecting elements in Firefox.
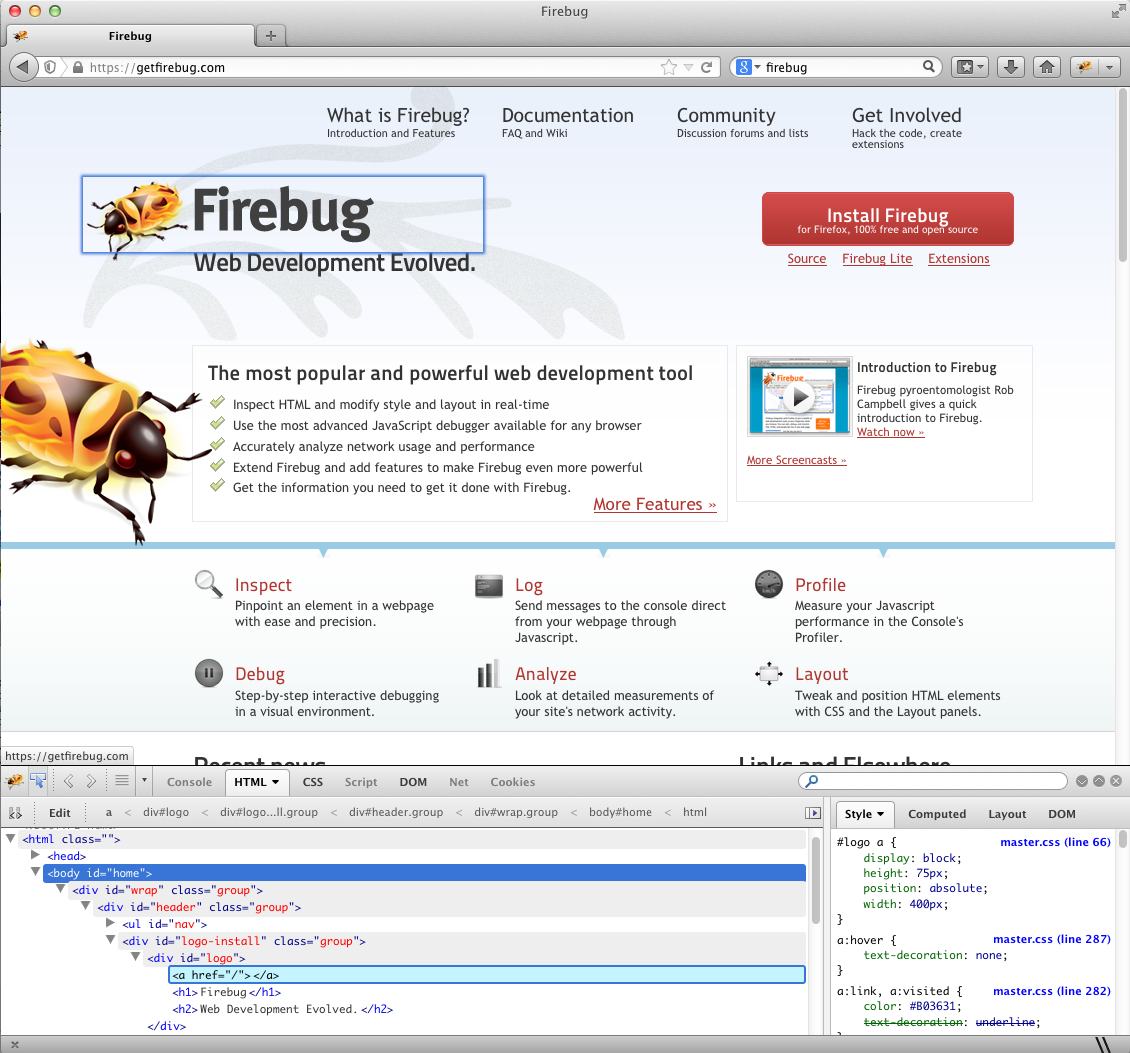
Firebug augments inspect element for Firefox
A detailed description of Firebug can be found here.
Safari Inspect Element:
Safari’s browser developer tool is not automatically activated within the browser and must first be configured through the settings, which can be frustrating for users who don’t know to expect that. Safari also offers an extremely simple and useful function of having a mobile device emulator setting making mobile testing on Safari a breeze.
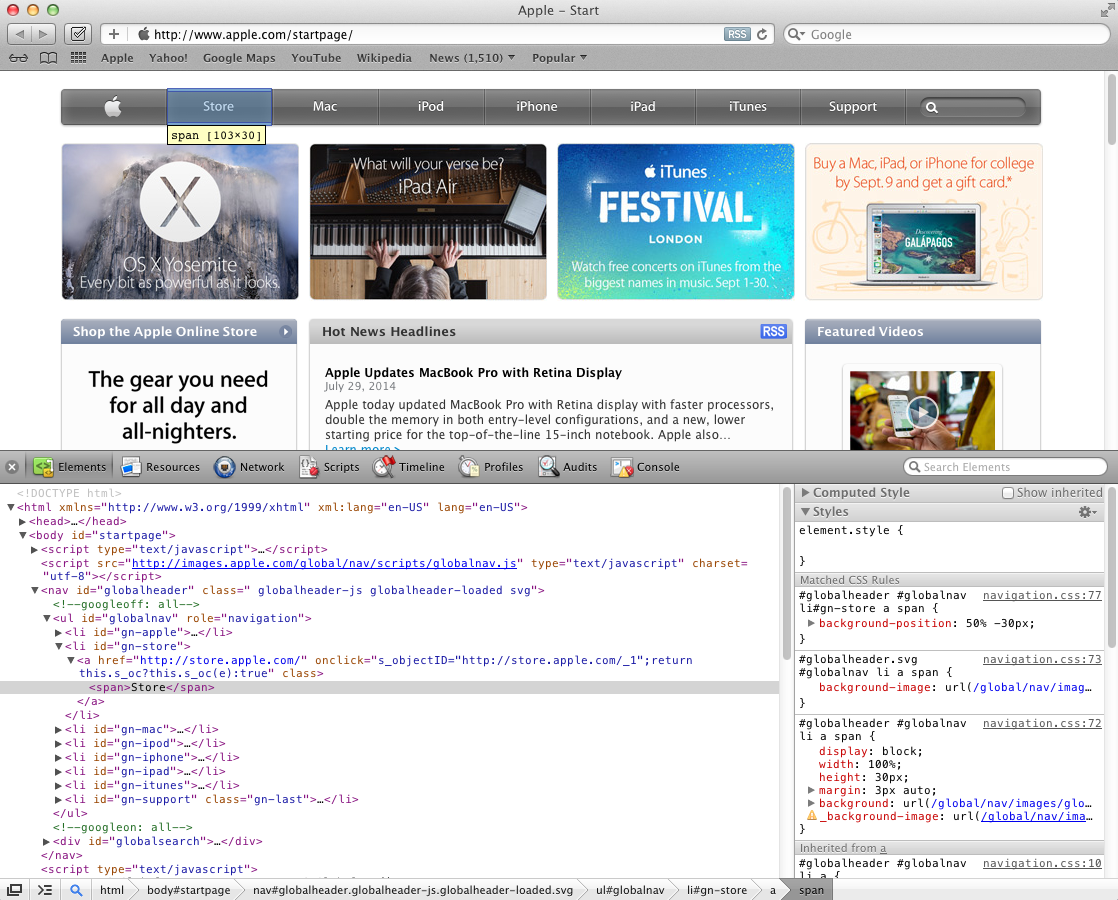
Safari’s Inspect element provides versatility with the mobile device emulator
Instructions on how to activate Safari Inspect Element and details on the added device emulator setting can be found here.
Google Chrome Inspect Element:
Chrome Inspect Element is a native development tool built into the Chrome browser. There is also a keyboard shortcut to quickly open up the tool, along with many other useful function shortcuts, making it extremely simple to use and the tool has the smooth feature functionality one would expect from Chrome.
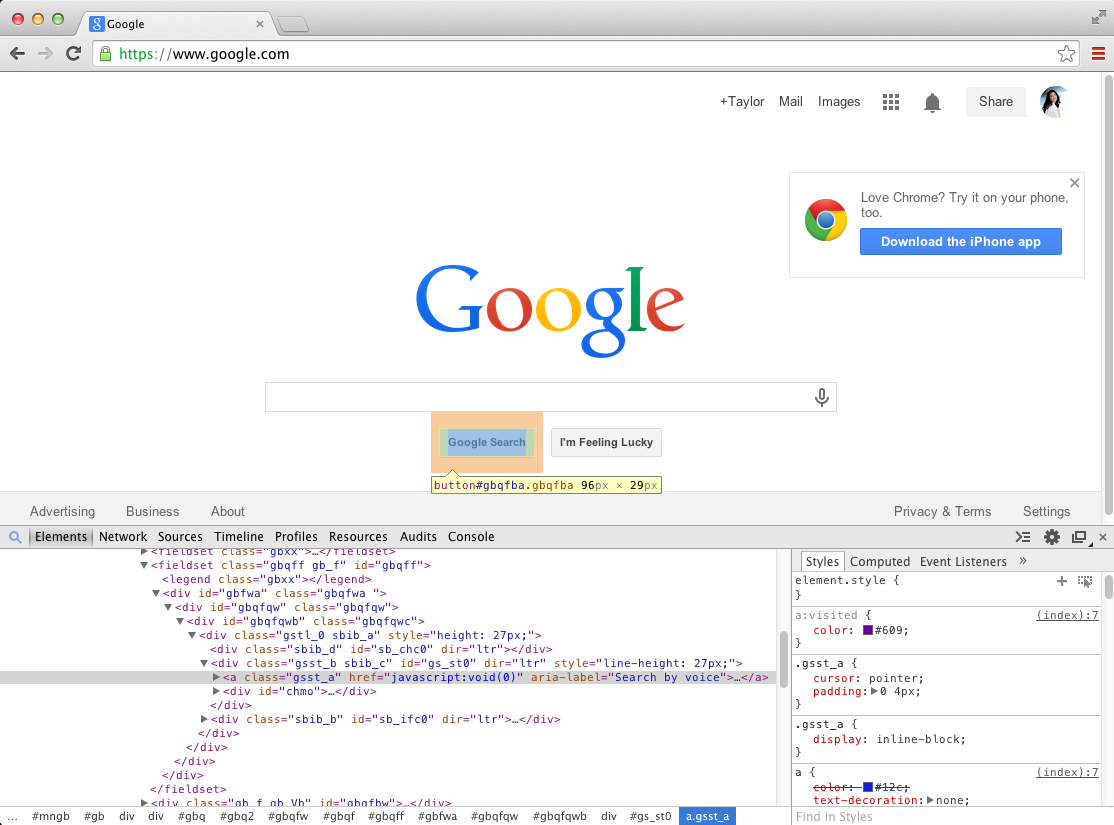
Chrome’s DevTools are intuitive and loaded with utility
A detailed description of Chrome Inspect Element along with the comprehensive list of the Chrome keyboard shortcuts can be found here.
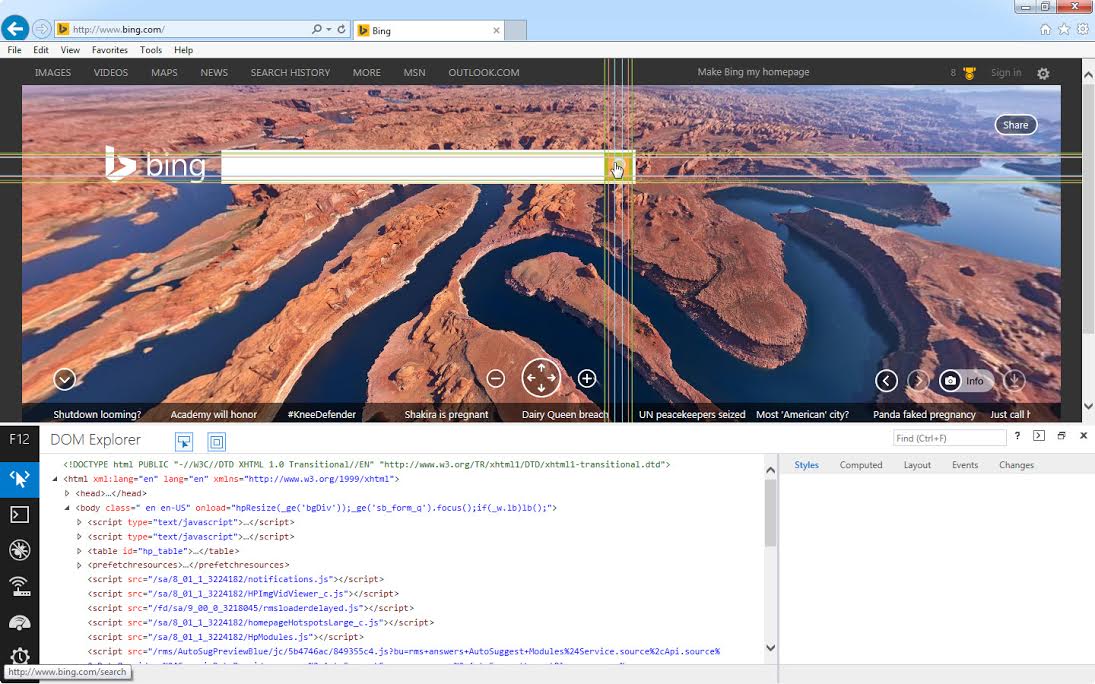
Internet Explorer’s DOM Explorer:
DOM Explorer is another native development tool, this is very simple to use when testing on Internet Explorer and it comes built into IE. This tool can be easily accessed by right clicking and selecting Inspect Element.
Check out more details about IE’s DOM from the link below
The IE DOM Explorer instructions and details can be found here.