One of the number one things our customers tell us they love about our test automation product Awetest is the expansive reporting module that includes not only high level data capturing and exporting but also how actionable the module becomes with the ability to drill down into the script level at any point and provide screen shots of the desktop where the tests are being run and the ability to make quick edits to the script using our built in editor.
Below is an detailed walk-through of the Awetest Reporting module which facilitates the delivery of actionable reporting including exporting, filtering, tracing, screen shots, meta data, performance measurement and charting capabilities.
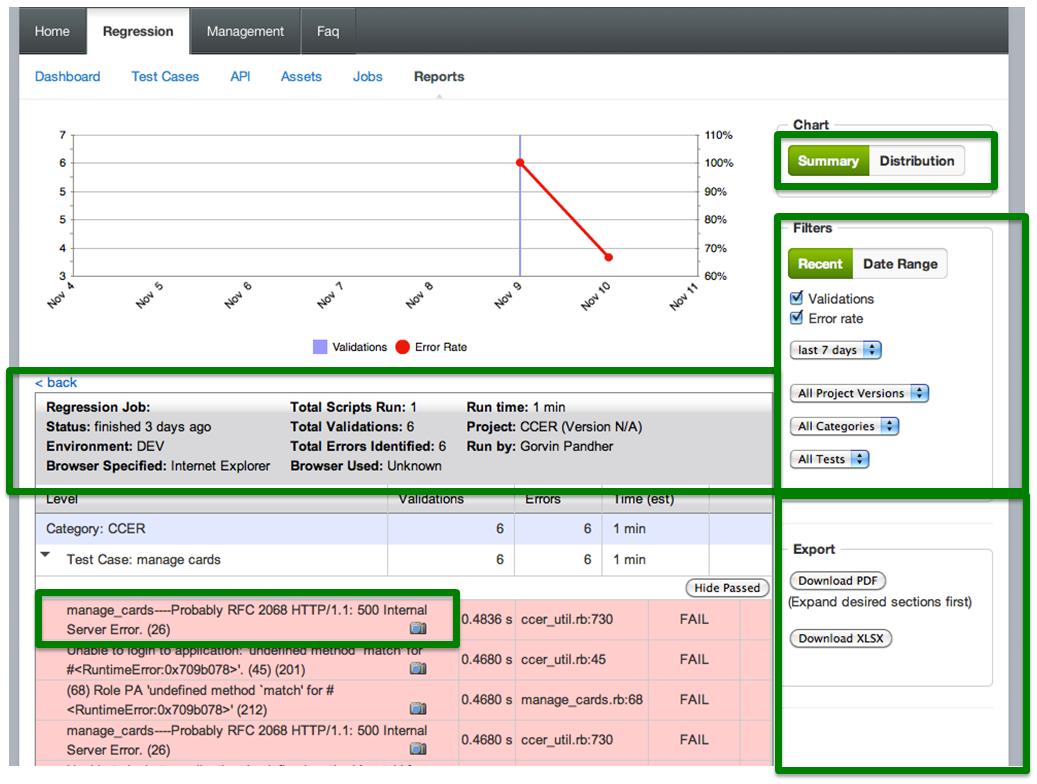
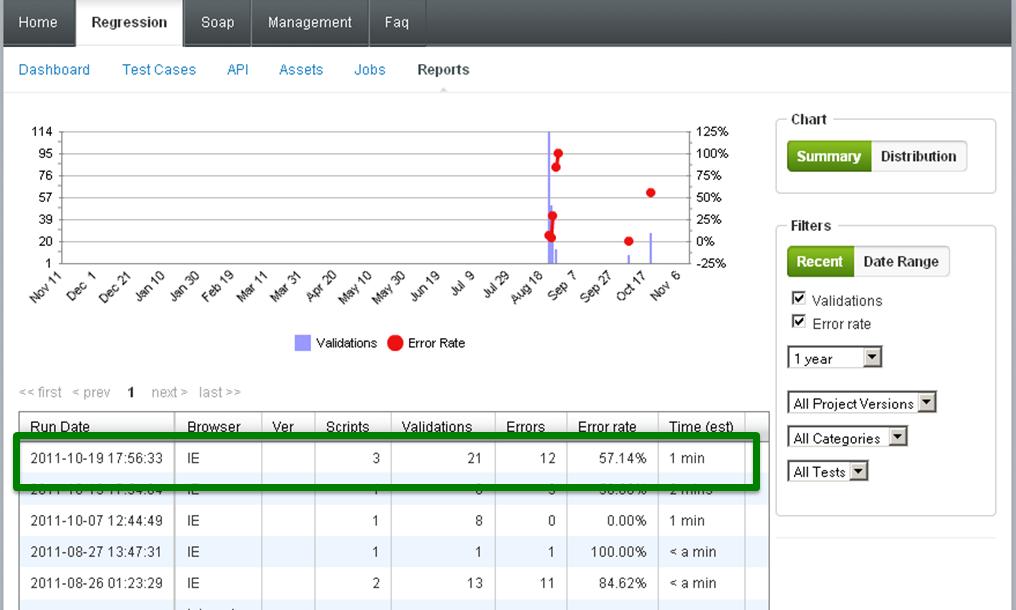
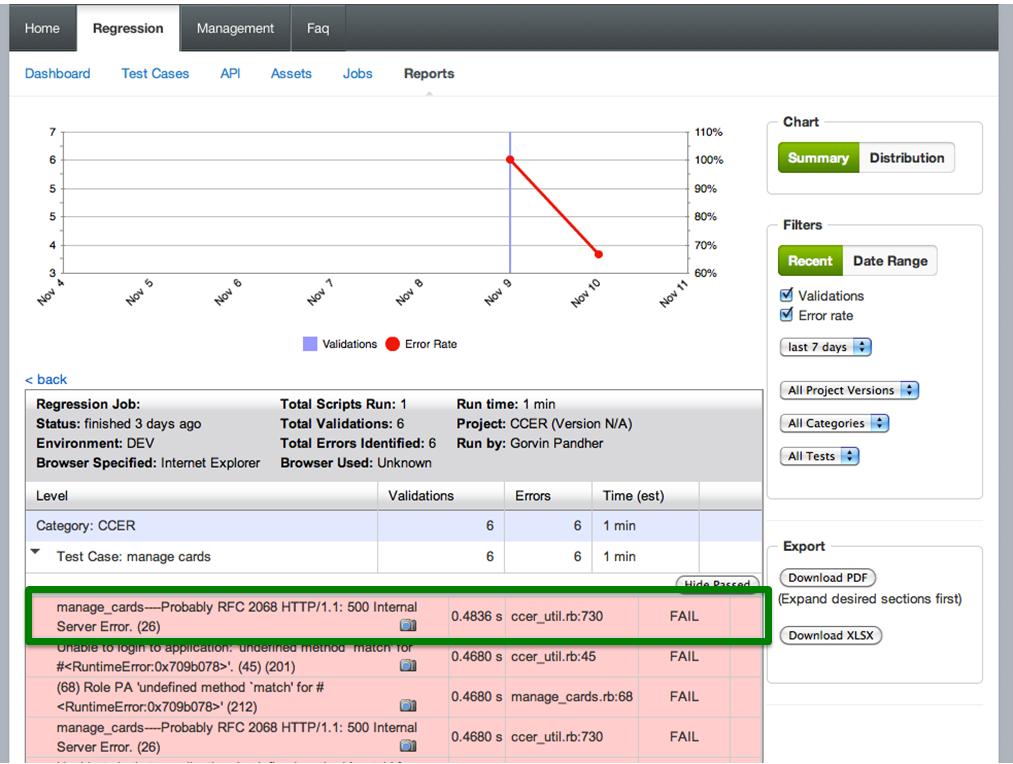
As you can see the reports interface includes multiple sections for handling the tasks mentioned above. Lets move through the page from left to right and explain each section with a bit more detail. At the top we have a defect percentage chart that plots the error rate over a designated time period, which can be set in the filters sections to the right of the chart.
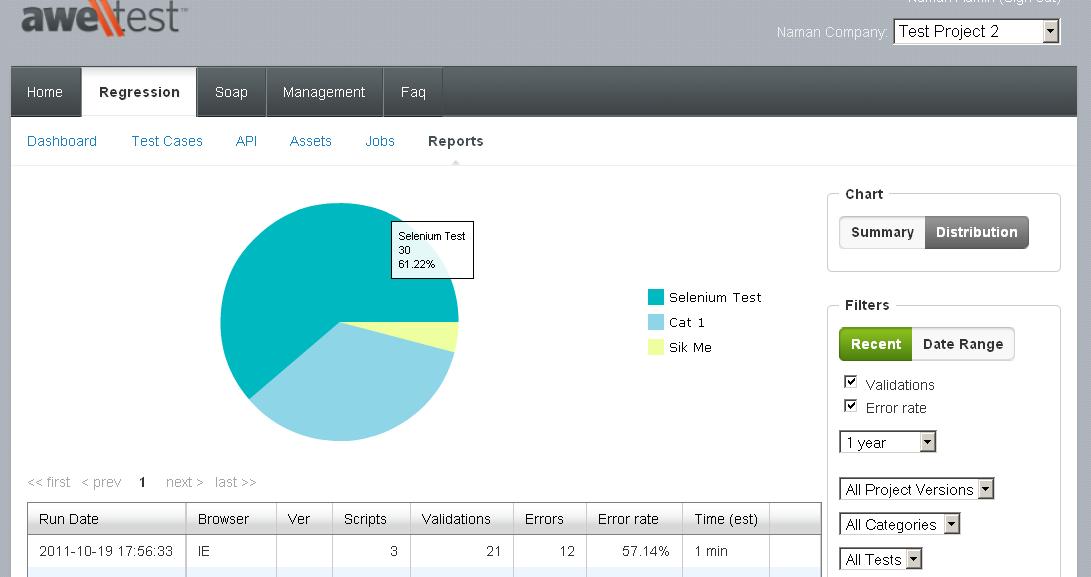
Under the chart section in the reports module you have the option to view the chart in a date/error rate summary view or a distribution pie chart view.
When you first enter the reports module, you will see all of your previously run jobs displayed with details like “Run Date”, “Browser”, “Version”, “Number of Scripts in the Job”, “Total Number of Validations for the Job”, “Number of Errors in the Job”,”Jobs Error Rate”, and “a Time Estimate for the job completion.” These details add up to give a great overview of previous runs. If you want to drill down deeper, you can click on one of the jobs in the list to be taken to that jobs details screen.
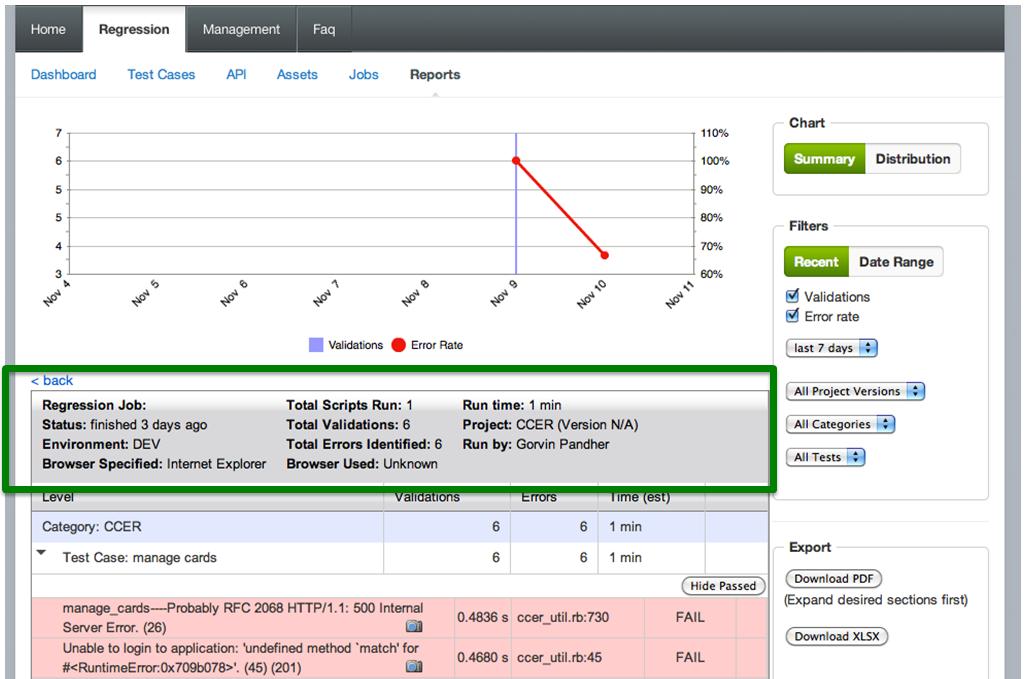
The job details screen provided a great deal of information aim at making the test automation professionals life as pain free as possible. Once you drill down into an individual jobs report, you will see a meta data section that gives you even more information about the job that was run. It provides info on the “Status”,”Environment”,”Browser Specified”,”Total Scripts Run”,”Total Validations”.”Total Errors Identified”,”Browser Used”,”Run Time”,”Associated Project”,” and “the Name of the User who ran the Script.”
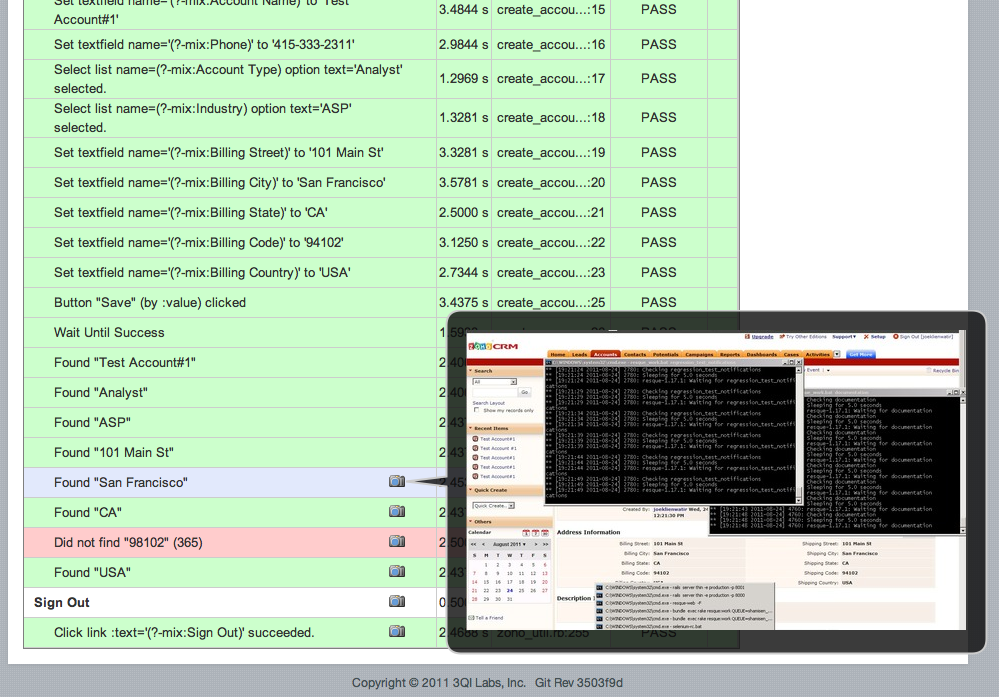
Also on the jobs details screen you will see a line by line log of the different scripts with more data about the test case run. This table provides the line in the script, a screen shot of the validation, the run time for that line in miliseconds and, of course, a nice big old PASS or FAIL accompanied by a red or green fill to help quickly identify the error in the script. But say your script is very long and mostly green PASSES. We had added a “Hide Passed” button to filter out all the green and leave you with only the red FAILS.
If you click on the little camera icon to the right of the validation a screen shot will pop up so you can see exactly what was happening at that moment on the machine and environment you were running the test on, whether running the test locally or on a virtual machine.
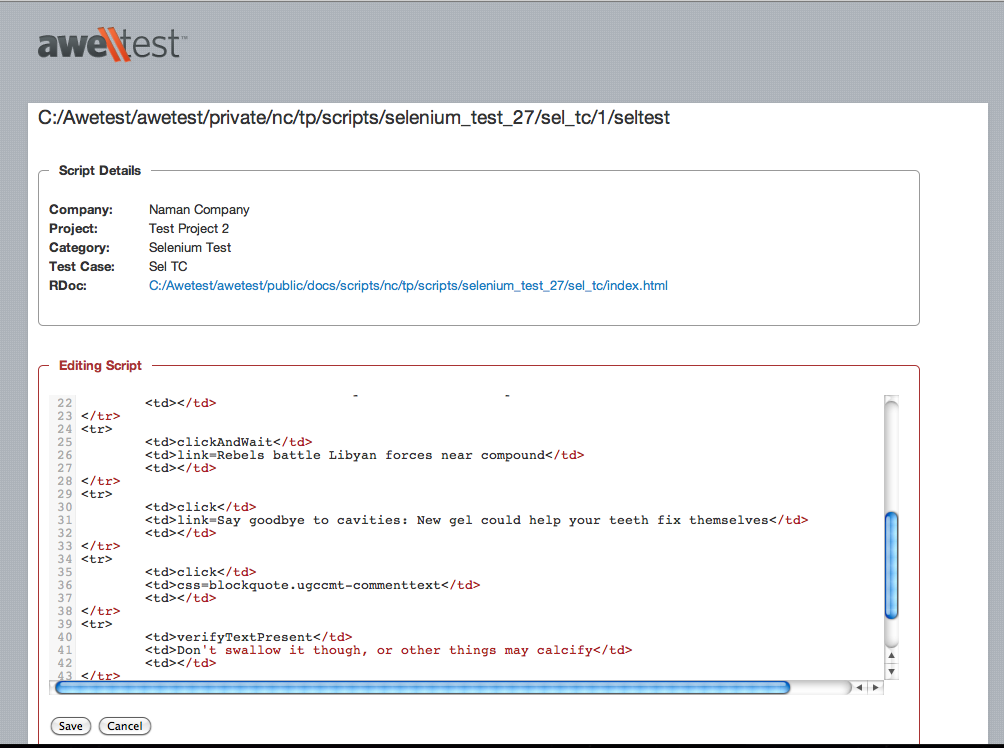
Clicking on a single line of a script from the jobs details screen opens up a script editor and take the user to that line in the script to make quick edits.
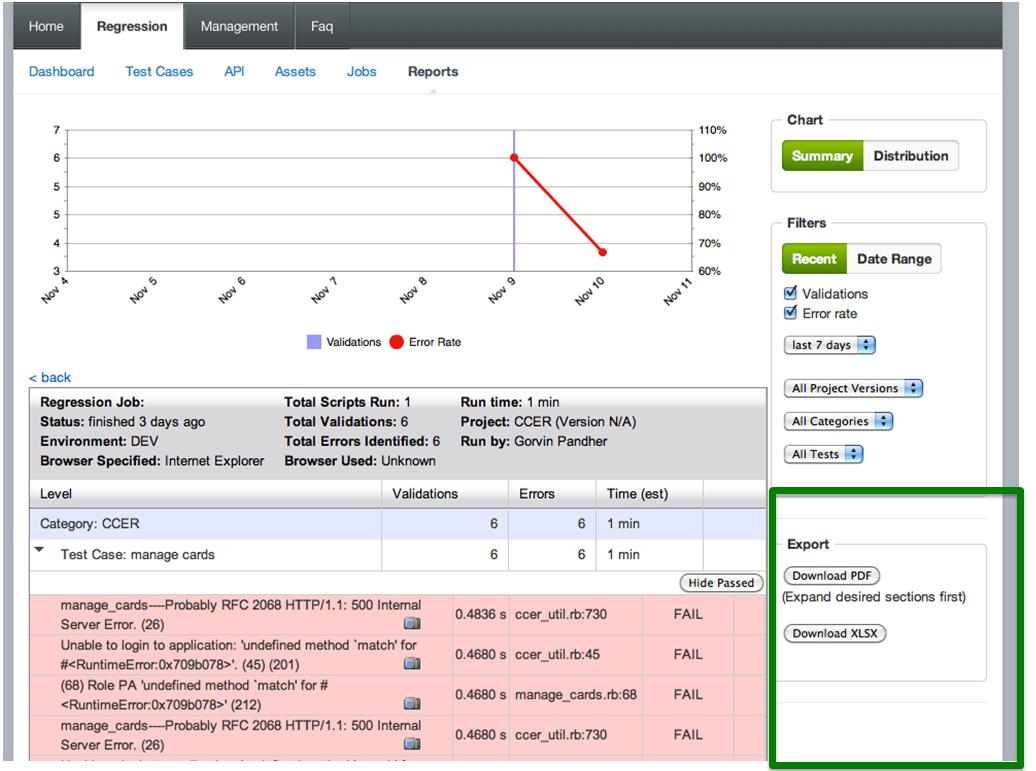
Lastly, Awetests reports module has a handy export feature that allows the user to export the report in either PDF or XLSX format making it easy to share the report with managers, team members, or clients who might not have access to the Awetest system.
The reporting function is a key feature that allows Awetest to deliver reports to our clients that is not only extremely detailed but easily actionable and a huge time saver for the test automation professional doing the reporting.

