The Issue
Debugging is a general term used to describe the function of identifying and addressing issues with code. Debugging automated tests is one of the most resource intensive and time-consuming aspects of building and maintaining automation. The issue is magnified as an automation suite continues to grow. Since debugging can be time and resource intensive, wrapping a process around this task can help facilitate efficiency in this area. This is especially helpful when the standard API usage does not yield the desired result. The debugging process in itself enhances the stability, reliability, and consistency of the code that is submitted to drive an organization’s automation.
The Answer
Pry is a powerful debugging tool for Ruby, allowing the user to debug code in real time. By doing so, the user is able to access the application in the same state in which the test is being ran. From here the user is able to invoke various functions from the command line based on the library files that were imported to the Ruby file.
In order to run Pry in your Ruby script, you must declare the following at the beginning of your script:
|
1 |
require 'pry' |
To subsequently invoke pry, at which point the script will pause and start a Pry session, the following command will be used:
|
1 |
binding.pry |
Once the pry session is open, it becomes easy for a user to manipulate the browser:
|
1 |
browser.goto "http://google.com" |
If the above command is typed into Pry, the browser will navigate to the address. This functionality becomes extremely useful when trying to identify objects on the page and validating if a particular element on the web page is functioning as expected. A user can check if a button is present on the page (using .present?), if the button exists on the page (using .exists?) and if the button can be clicked (using .click).
The Code
Lets look at a sample script, and implement Pry. What we are doing here is validating the existence of an element that is giving us an error for our next step. By validating what the correct element is, we will debug our broken line of code.
|
1 2 3 4 5 6 7 8 |
#prydebug.rb require 'pry' require 'watir-webdriver' require 'rubygems' browser = Watir::Browser.new :chrome browser.goto 'bit.ly/watir-webdriver-demo' binding.pry browser.input(:id,"s-submit").click |
At the point of binding.pry in the script, the pry session will open in our command line. At this point we can enter the following to validate that an element exists:
|
1 |
browser.input(:id,"s-submit").exists? |
The element does not exist. So, we can go ahead and find the correct element of the submit button using our browser’s inspector. After finding the element, we can again validate if it exists using the correct id:
|
1 |
browser.input(:id,"ss-submit").exists? |
After the element is validated, we can be free to remove pry, and fix our incorrect code:
|
1 2 3 4 5 6 |
require 'pry' require 'watir-webdriver' require 'rubygems' browser = Watir::Browser.new :chrome browser.goto 'bit.ly/watir-webdriver-demo' browser.input(:id,"ss-submit").click |
The Result
Let’s save our file (prydebug.rb) and run it from the command line. Here is a breakdown of the result:
- Browser opens
- Browser navigates to the Watir Webdriver Demo URL
- Pry session is invoked
- We enter a command to validate an element
- We receive a false message, indicating the element does not exist
- We inspect the element via the browser, and obtain the correct ID
- We validated the element with the correct ID
- We can remove Pry from our script, and replace the incorrect element ID with our newly validated element ID
Here is what the Pry session looks like in our command line after running:
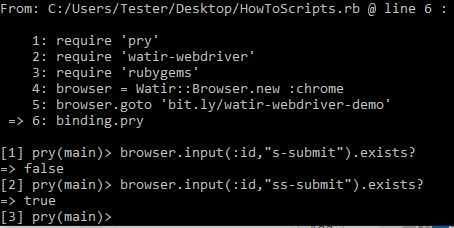
The Takeaway
Being able to effectively fix your automation is just as important as creating it, and Pry will give you a solid foundation to begin debugging your test scripts. Using debugging tools will only further your comfort with test script maintenance, and automation as a whole.