Once you have understood the value of debugging with IRB, debugging with Pry is an intuitive process. Pry is a powerful alternative to the standard IRB shell for Ruby, featuring syntax highlighting, a flexible plugin architecture, runtime invocation, and source and documentation browsing. Using Pry to Debug Watir Webdriver scripts is intrinsically the same as using IRB but one of the main advantages of Pry is the ability to invoke it in the middle of a running program. This allows you to use multiple Pry sessions to address problematic areas of your test during debugging. Furthermore, Pry is able to access commands from various libraries including Cucumber, Watir-Webdriver, and Selenium, making it a versatile asset.
The first step to engaging Pry is including the following lines in the step definition (.rb file) of your automated testing script at the point you wish to start debugging (this will pause the running script and start a Pry session):
|
1 2 |
require ‘pry’ binding.pry |
In this example, we’ll focus on debugging a simple script used for testing the University of South Florida website. The function of the script is to open a new window, go to USF’s homepage, navigate through the site to their Colleges page, and search the term “Marketing” in their top search bar:
|
1 2 3 4 5 6 7 8 9 10 |
require 'watir-webdriver' require 'watir-webdriver' require 'pry' browser=Watir::Browser.new browser.goto "www.usf.edu" browser.span(:text,"Search for undergraduate majors").click browser.window(:title,/Undergraduate/).use browser.a(:href,"http://www.usf.edu/academics/colleges.aspx").click browser.text_field(:id,"top-bar-search-input").set "Marketing" browser.input(:id,"site-search-submit").click |
However, running this script produces an error:
watir-webdriver/elements/element.rb:507:in `assert_exists':

unable to locate element, using {:id=>"top-bar-search-input",

:tag_name=>"input or textarea", :type=>"(any text type)"}

(Watir::Exception::UnknownObjectException)
The issue here is Watir being unable to locate the text field named "top-bar-search-input". Thus we will insert a binding.pry before the problematic script in order to effectively troubleshoot the issue within a Pry session. Our script will now look like this:
|
1 2 3 4 5 6 7 8 9 10 11 12 13 |
require 'watir-webdriver' require 'watir-webdriver' require 'pry' browser=Watir::Browser.new browser.goto "www.usf.edu" browser.span(:text,"Search for undergraduate majors").click browser.window(:title,/Undergraduate/).use browser.a(:href,"http://www.usf.edu/academics/colleges.aspx").click binding.pry browser.text_field(:id,"top-bar-search-input").set "Marketing" browser.input(:id,"site-search-submit").click |
When you execute this script in the command line, the test will run till the pry session is invoked. At which point, you will be able to jump back into the terminal and start executing your Watir and/or Cucumber commands.
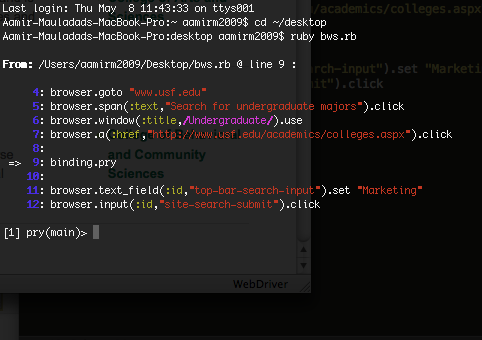
Here is our Pry Session
Now, we run our new script and we are brought to the USF Colleges page. We find the search bar in question and inspect element in order to confirm that we have the correct element name.
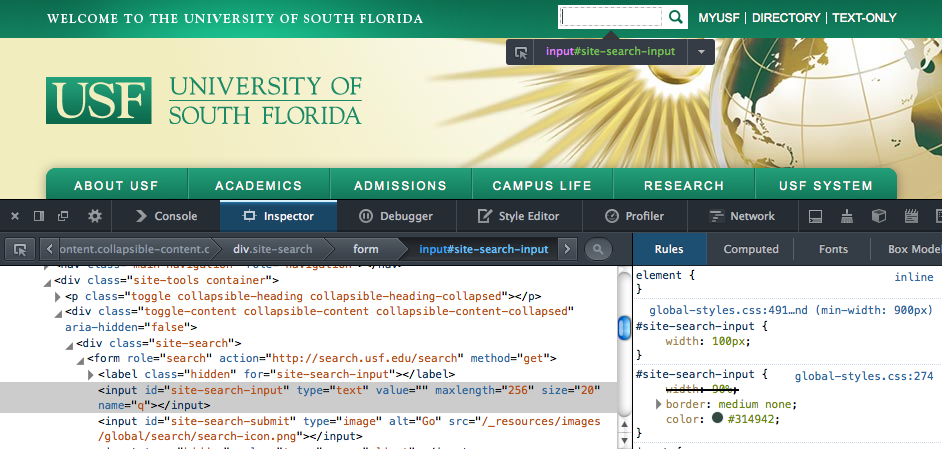
We can find the correct element for the search bar using ‘Inspect Element’
We find that the name of the search bar is in fact "site-search-input". Switching this text out with "top-bar-search-input" should hopefully fix the script and produce the result we want. In order to ensure this is the correct change, we will enter this script into our Pry session:
|
1 |
browser.text_field(:id,"site-search-input").set "Marketing" |
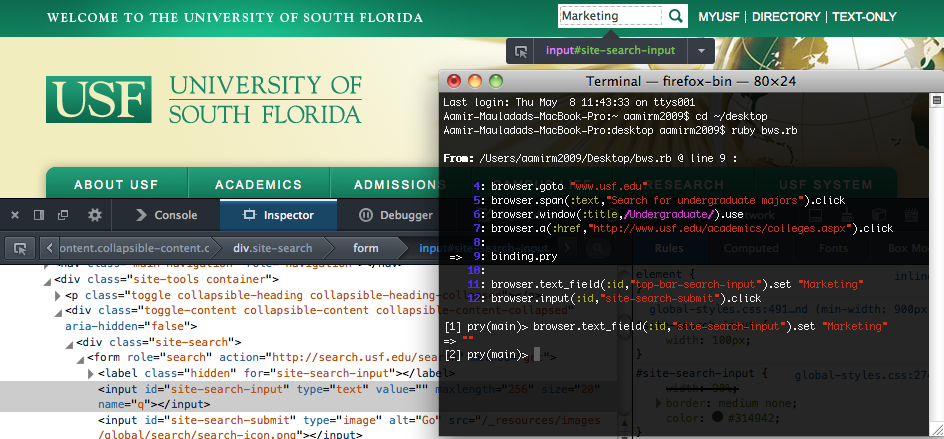
With the correct element, our command is successful
And there we go! When we run this command in the Pry session, the term “Marketing” is entered into the search bar, thus fixing our broken script. Now that we know this command works, we we can substitute it for the problematic command. As you can see, debugging with Pry is simple and effective solution to debugging, allowing you to troubleshoot a specific issue without having to rerun the script every time. Again, binding.pry can be used anywhere in the script and as many times as you want. Once you have completed your Pry session, you can use CTRL+D (in OS X) to exit the session, and execute the subsequent script.
For reference, our finalized script will look like this:
|
1 2 3 4 5 6 7 8 9 |
require 'watir-webdriver' require 'pry' browser=Watir::Browser.new browser.goto "www.usf.edu" browser.span(:text,"Search for undergraduate majors").click browser.window(:title,/Undergraduate/).use browser.a(:href,"http://www.usf.edu/academics/colleges.aspx").click browser.text_field(:id,"site-search-input").set "Marketing" browser.input(:id,"site-search-submit").click |